Dealing with Data
Format
This is a short reference list of resources to help you groom datasets
Target Audience
Project leads and contributors trying to wrangle data for a project
Materials
- Text editor & or etherpad for notes
Introduction
Data munging is an essential part of almost every hackathon workflow and understanding more about the formats and structure of your data will help you complete your projects
This exercise will walk you through some resources and libraries designed to help you build
Steps to Complete
-
Brush up on formats
Browse the following details about file formats and data types to make sure you're familiar with the general vocabulary of some of the subsequent sections.
Formats
- JSON - Javascript Object Notation, data objects made of attribute-value pairs
- CSV - Comma-Separated Values, tabular data delimted by `,` s to suggest different fields, you can convert excel spreadsheets to this easily, and it can be read into your code
- TSV - Tab-Separated Values, same as above, but `tab` is the delimiting
- XML - eXtensible Markup Language
You can tell the format of a file by its extension, or the letters that follow the `.` after the file name.
Types
- Dates | Friday, September 24th, 2004
- Integers | "1"
- Booleans - "TRUE"
- Characters | "a"
- Floats - "1.2435"
- Strings - "aurelia"
Considerations
Consider what you want your project to look like, how you want your user to interact with your project, the type of data set and data formats you're relying on, and the type of visualization you'd like to make, in the end.
If you're wanting to get started with a dataset that is not your own, you can follow the tutorial from Michelle Minkoff at ForJournalism: http://forjournalism.github.io/courses/charting-and-visualization/.
-
Check out libraries
Tools for Data Visualization
All are pretty customizable with CSS, so don't feel bound to their default designs.
Javascript
Python
Tools for Data Wrangling
- Python Data Management Libraries: little index of resources
- Journalists' Guide to datsets: nice resource for common but complex datasets
- Data Wrangling Handbook: features nice tutorials on how to deal with data
- DSV: a parser and formatter for delimiter-separated values
- Tabula: tool for extracting data from PDFs
-
Choose an approach
Figure out what you most want to do with your data and determine which libraries or types of visulization might best suit what you're working on.
Consider that maybe your tool is not particularly visual, but you need to include or accept data in the formats and types described above, and plan accordingly
Glossary
Open Data
Data that is made easily and freely available for anyone to access, use, and share without restrictions, the possible exception being a requirement of attribution.
File Formats
A standard way that information is encoded for storage in a computer file. File formats may be either proprietary or free and may be either unpublished or open.
Follow-up Resources & Materials
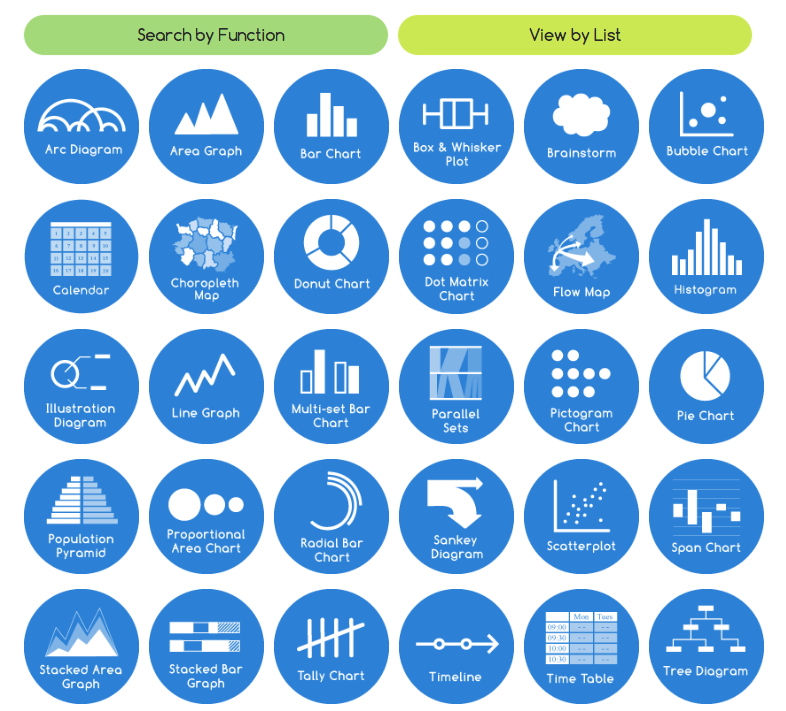
You may find it useful test out types of visualizations before you attempt to code them.
The following resources are useful for testing.
- CodePen: browse lots of visualization types there
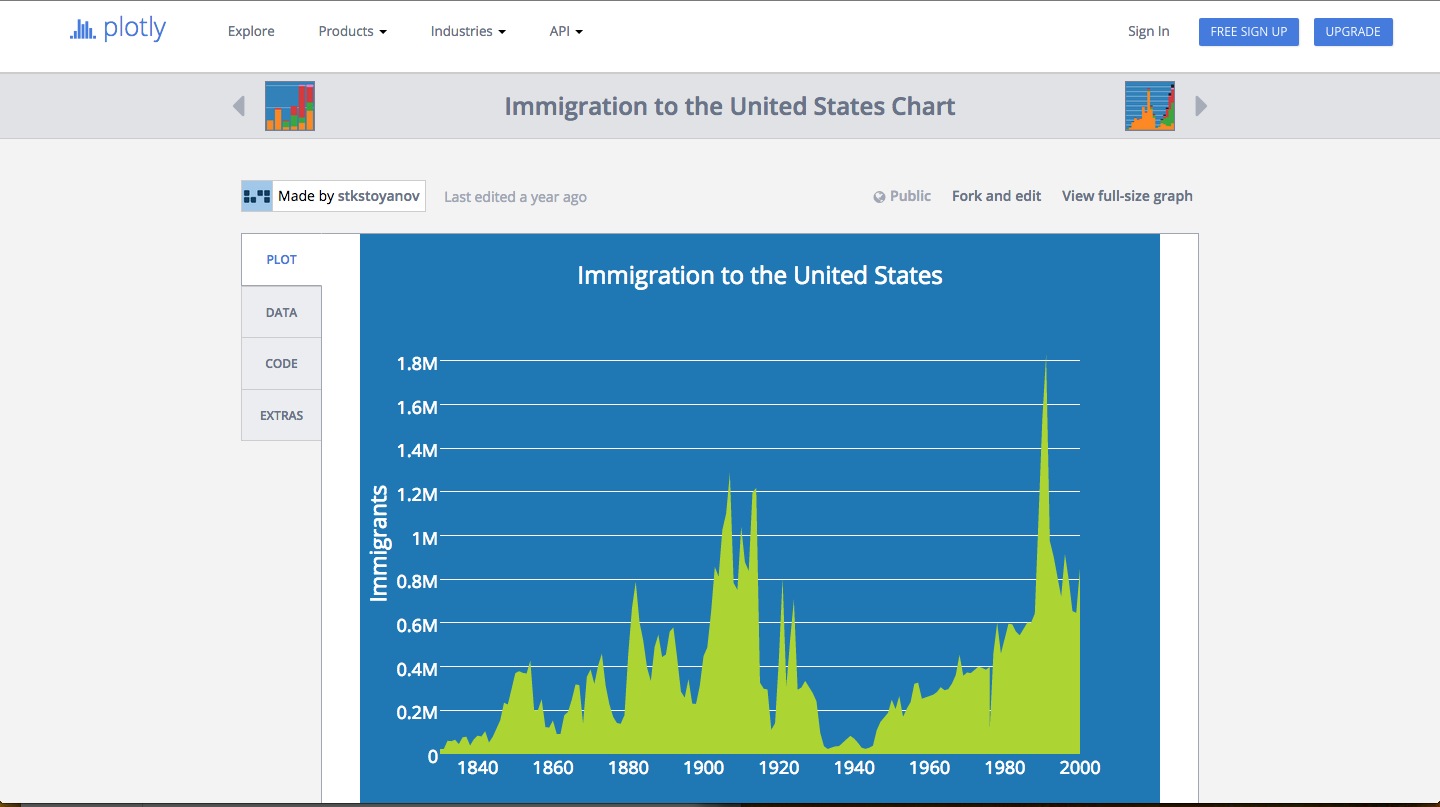
- RAW: easy way to drag and drop data into a variety of generated D3 prototypes.
- Highcharts demos: each has a jsfiddle where you can drop in your own data.